

Clarity in your numbers.
We help businesses and nonprofits clean up, manage, and understand their financials.
When you’re too big to ignore your numbers… but not quite ready to hire a full-time accounting team.
CPA-led service focused on helping growing organizations bring structure, and clarity to their financials.

Bank & Credit Card Reconciliations
General Ledger Cleanup
Fixing Misclassified Transactions
Equity/Open Balance Issues
Catch-up Bookkeeping
Preparing Clean Financials
Transaction Categorization
Monthly Close Process
Financial Statements (P&L, Balance Sheet)
Ongoing Reconciliations
Support for Questions & Adjustments
Budgeting & Forecasting
Cash-flow Planning
Financial Analysis
KPI tracking/Custom Reporting
System Integrations
Automation and Efficiency
Our Services
Cleanup & Catch-up
We go back, fix what’s broken, and bring your books to a clean, reliable state.
Bookkeeping & Monthly Close
Ongoing bookkeeping that stays clean - every single month.
Advisory & Controller Services
This is where the real value is—turning numbers into decisions.




-
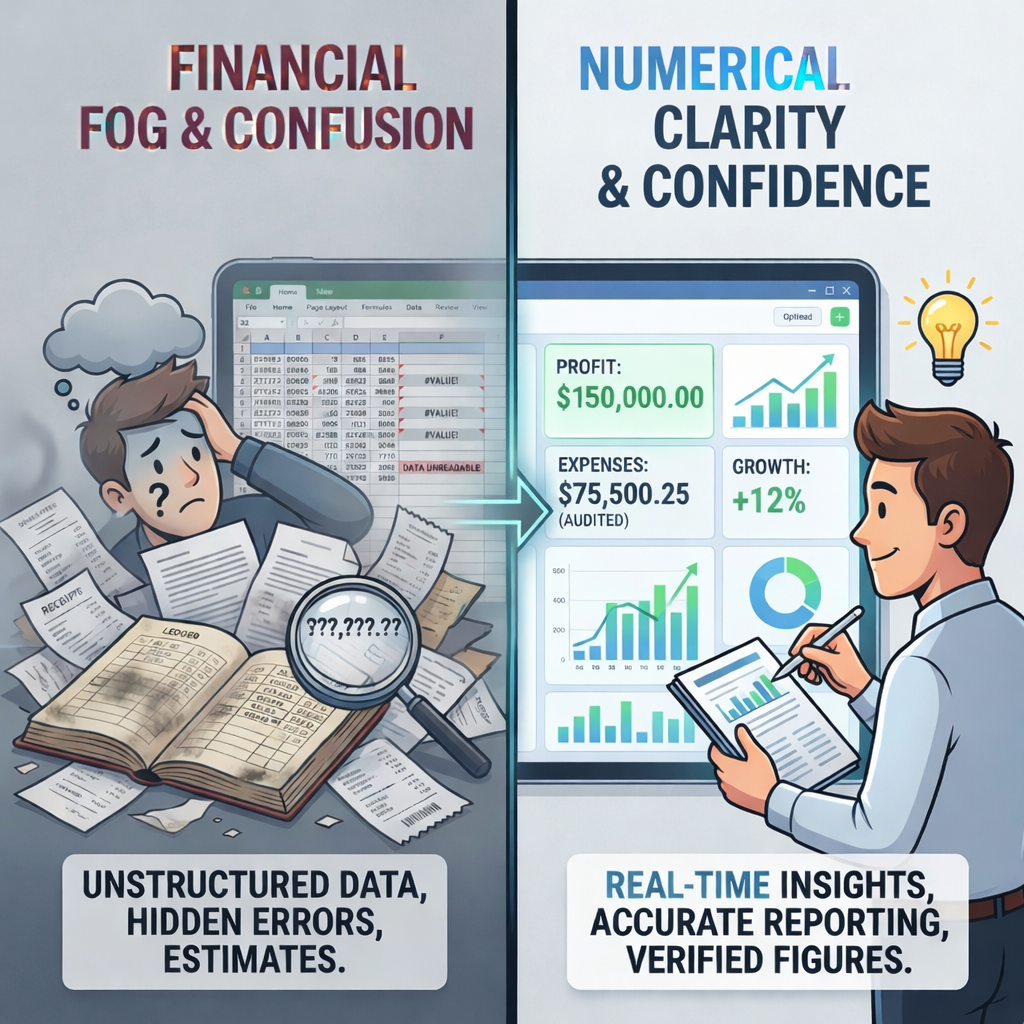
![Comparison of disorganized, confusing financial data on the left with clear, accurate, real-time financial analysis on the right.]()
Clarity in Numbers.
If your books don’t tie out, reports feel inconsistent, and you’re never quite sure what the real numbers are - guessing isn’t a strategy anymore.
We step in to clean, organize, and standardize your financials so everything actually makes sense. From fixing misclassifications and reconciling accounts to building clear, reliable reporting, you’ll get numbers you can trust and use to make real decisions with confidence.
-
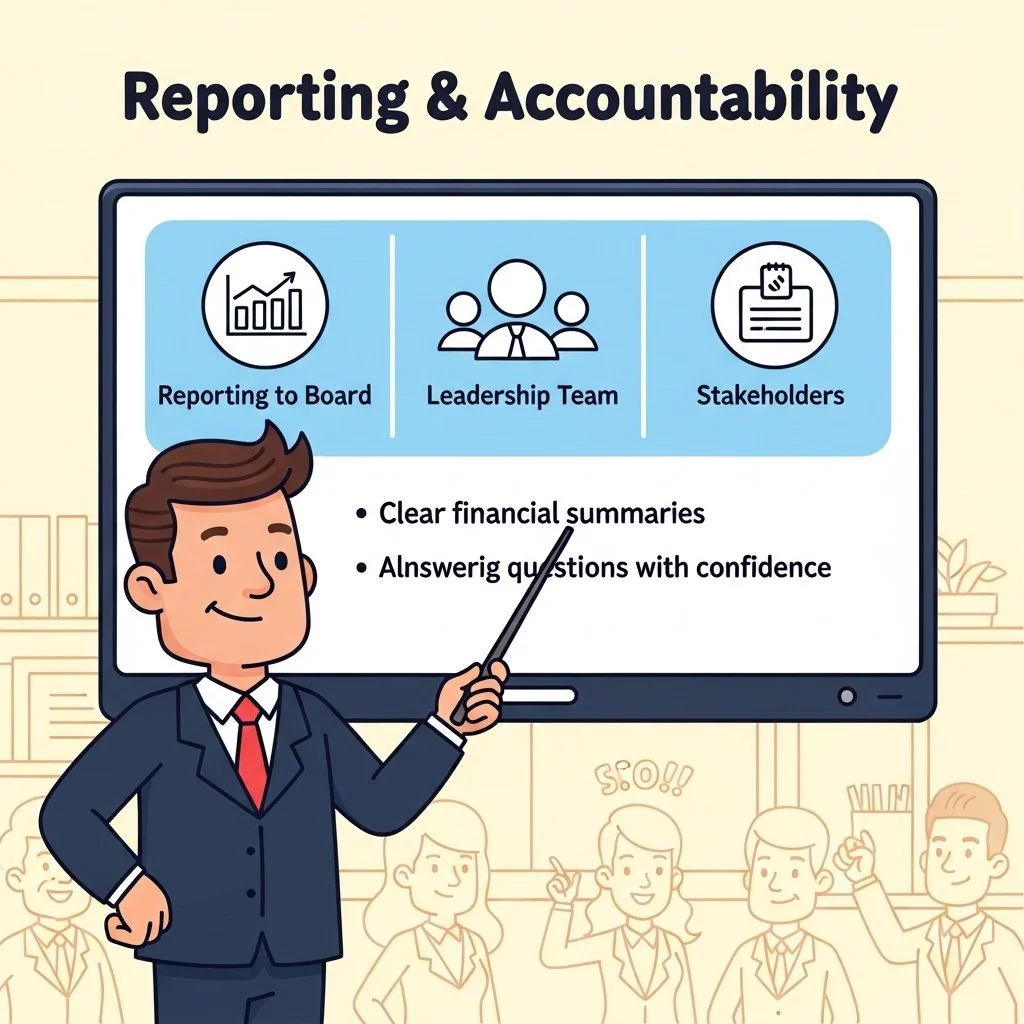
![Illustration of a man in a suit giving a presentation on reporting and accountability, with a screen showing icons and text about reporting to board, leadership team, and stakeholders, and points about clear financial summaries and answering questions confidently.]()
Reporting & Accountability.
When it’s time to report to your board or leadership team, unclear numbers and inconsistent reports make it hard to tell the real financial story.
We bring clarity and structure to your reporting. From building clean, board-ready financial summaries to ensuring consistency across reports and supporting your presentations, we give you numbers you can stand behind so you can communicate clearly, answer questions confidently, and lead with credibility.
-
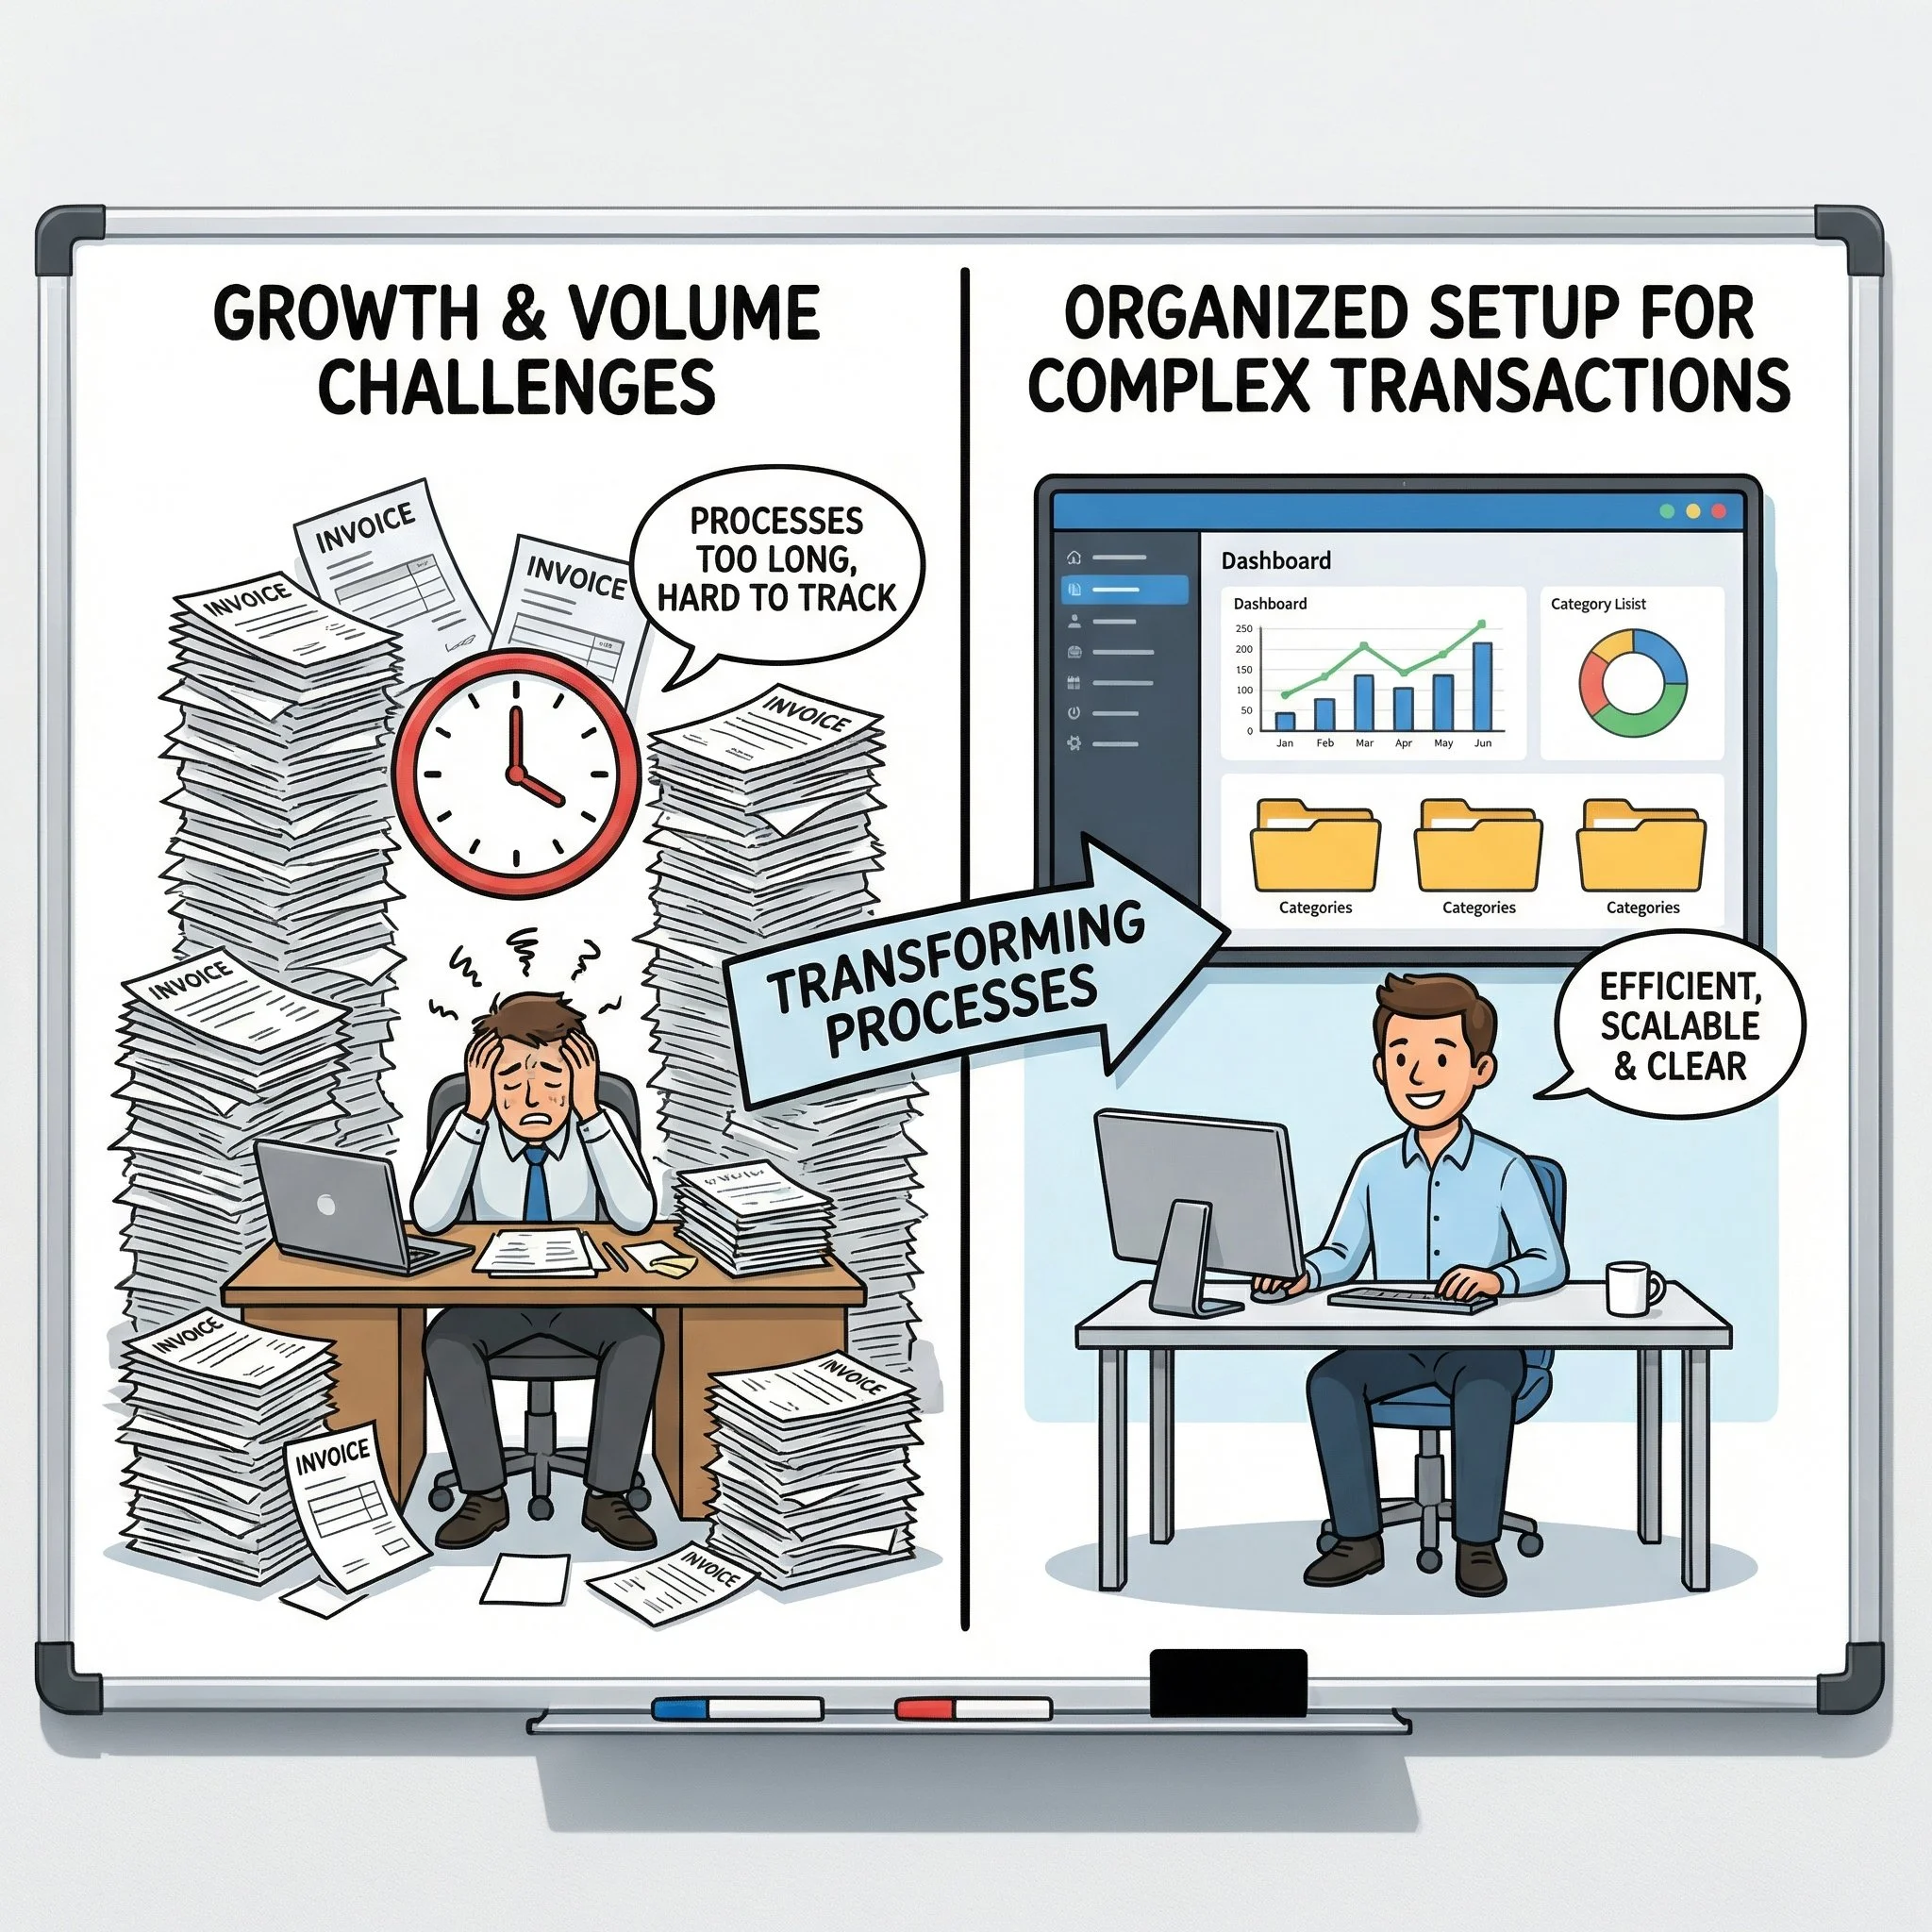
![Comparison of work processes: left side shows an overwhelmed person surrounded by piles of invoices with a clock and a speech bubble saying 'Processes too long, hard to track'; right side shows a calm person at a desk with a computer, data visualization, and folders, with a speech bubble saying 'Efficient, scalable & clear,' illustrating transforming chaotic processes into organized workflows.]()
Growth & Volume.
When transaction volume grows, basic bookkeeping starts to break down, processes slow, backlogs build, and it becomes harder to stay on top of what’s actually happening.
We step in to streamline your setup. From structuring workflows for higher volume to organizing complex transactions and improving efficiency, we keep you on track so your financials stay accurate, timely, and ready to support real growth decisions.
-
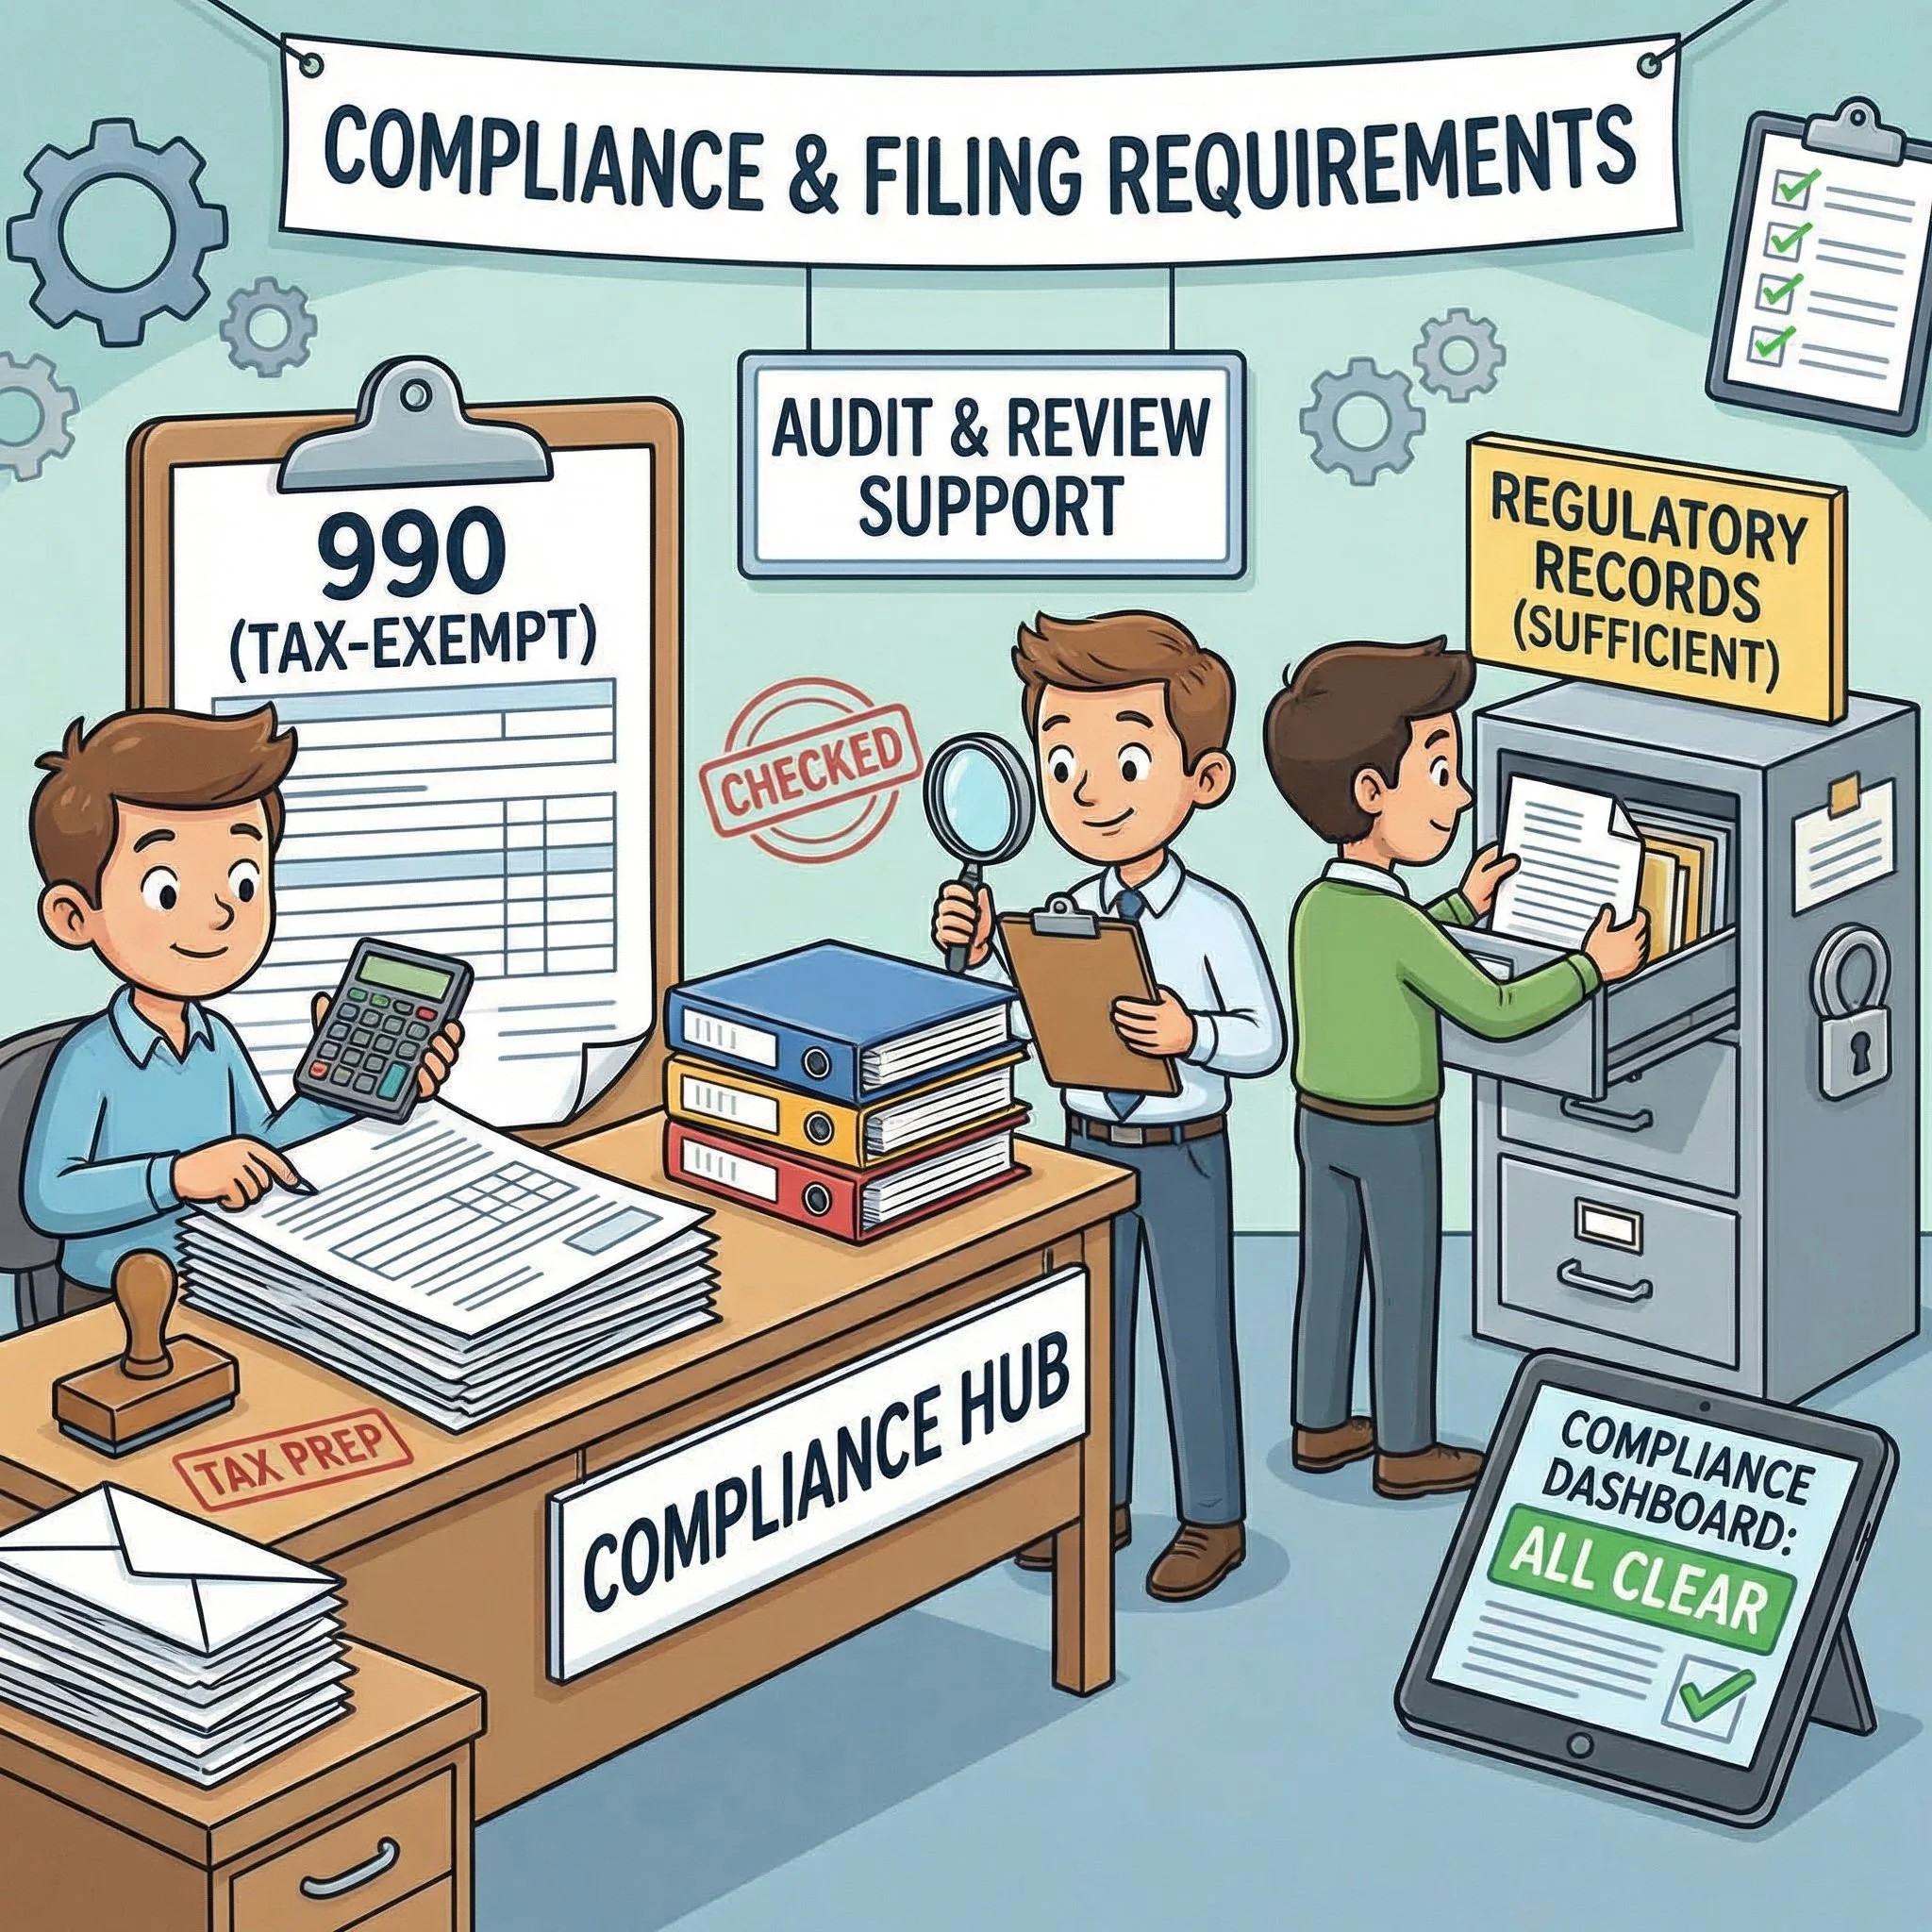
![Illustration of a compliance and filing support office with three men working at a desk and filing cabinet. Signs show tax-exempt status, regulatory records, and compliance dashboard indicating all clear.]()
Compliance & Reporting Support.
When filing deadlines approach, audits are on the horizon, and your records aren’t fully organized, uncertainty starts to build - and the risk of errors or delays goes up fast.
We help to get audit-ready. From preparing clean, supportable records for Form 990 filings to organizing documentation for external audits and reviews, we make sure your financials meet regulatory requirements - so you can move forward with confidence, not stress.
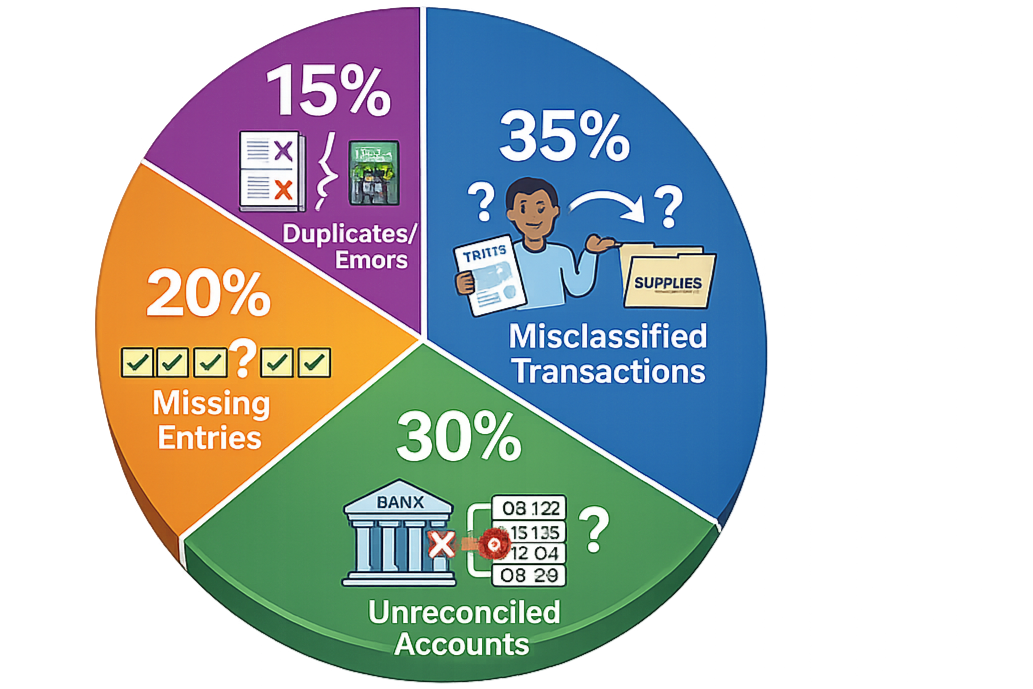
Where financials typically break down
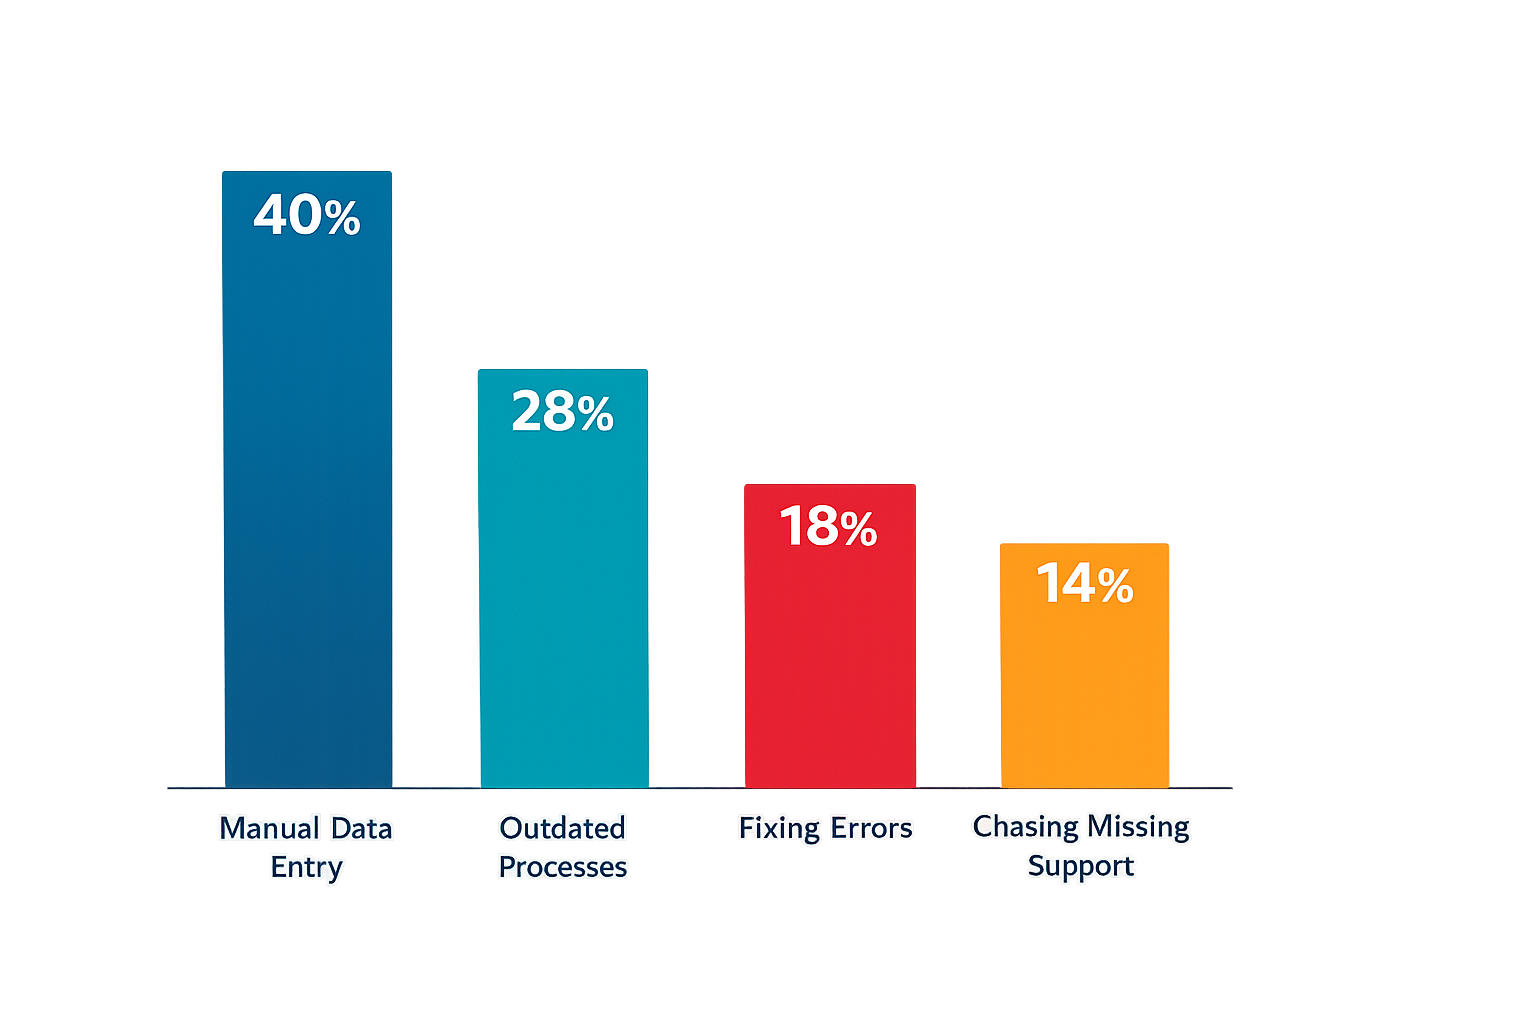

Where time is wasted
Let us do the work
-
We’ll start with a free consultation call to review of your current setup and where things stand.
From there, we’ll determine:
What needs to be fixed
What can be improved
What the right next step looks like
No pressure, no overcomplication—just a clear path forward
-
This is a good fit if you:
Have outgrown your bookkeeping
Require financial prep for Audit/Review
Need to create structure without hiring a full-time team
-
Clean, reliable financials
A structured monthly process
Clear visibility into performance
Confidence in your numbers
Fill out the form below and we’ll follow up within 1–2 business days.